Welcome
Hi.
I’m a data specialist, based in Scotland.
Why do I have a blog?
I saw an article that said anyone who writes code should have a blog.
This is my attempt at following that advice.
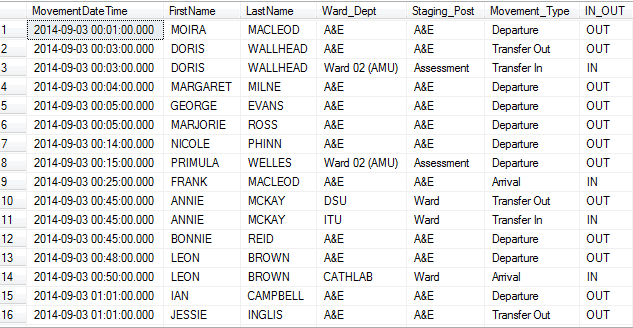
Iterating over multiple database tables with the tidyverse
Extracting data from multiple database tables with dplyr and purrr. Continue reading Iterating over multiple database tables with the tidyverse

Exploring your database with shiny
Programatically querying a database with flexible SQL queries and visualising the results with shiny. Continue reading Exploring your database with shiny
On target
A beginners introduction to getting started with the targets package in R Continue reading On target
simpler SQL with dplyr
comparing dplyr with SQL nested queries - and there is only one winner Continue reading simpler SQL with dplyr
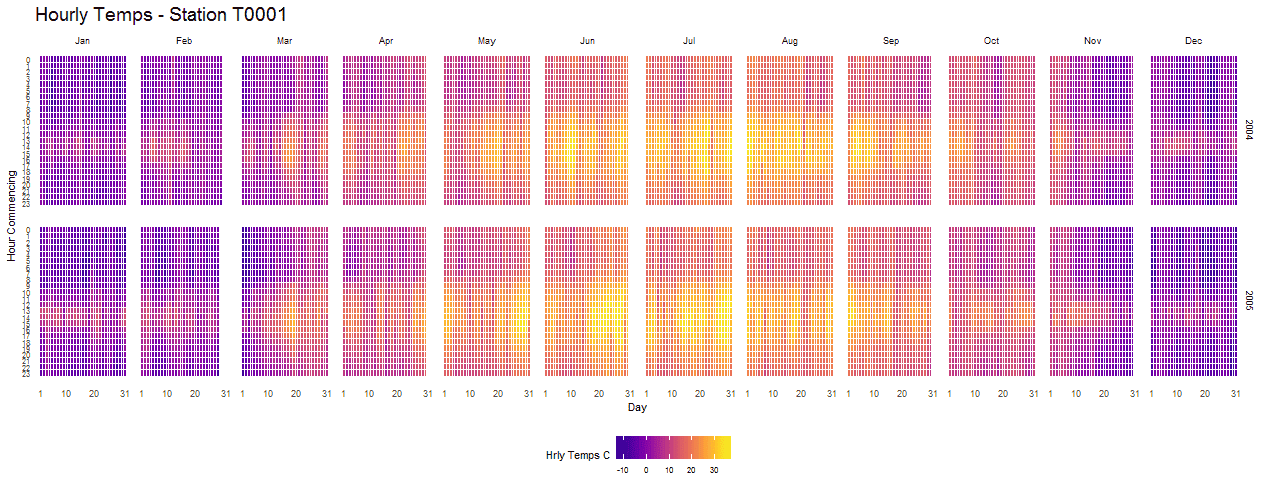
The hourly heatmap with ggplot2
A 24/7 timeseries heatmap with ggplot2, dplyr and lubridate Continue reading The hourly heatmap with ggplot2
demystifying the coalesce function
coalesce is one of the most useful functions that you’re probably not using. Want to find the first non NA value from one or more vectors? You need coalesce Continue reading demystifying the coalesce function
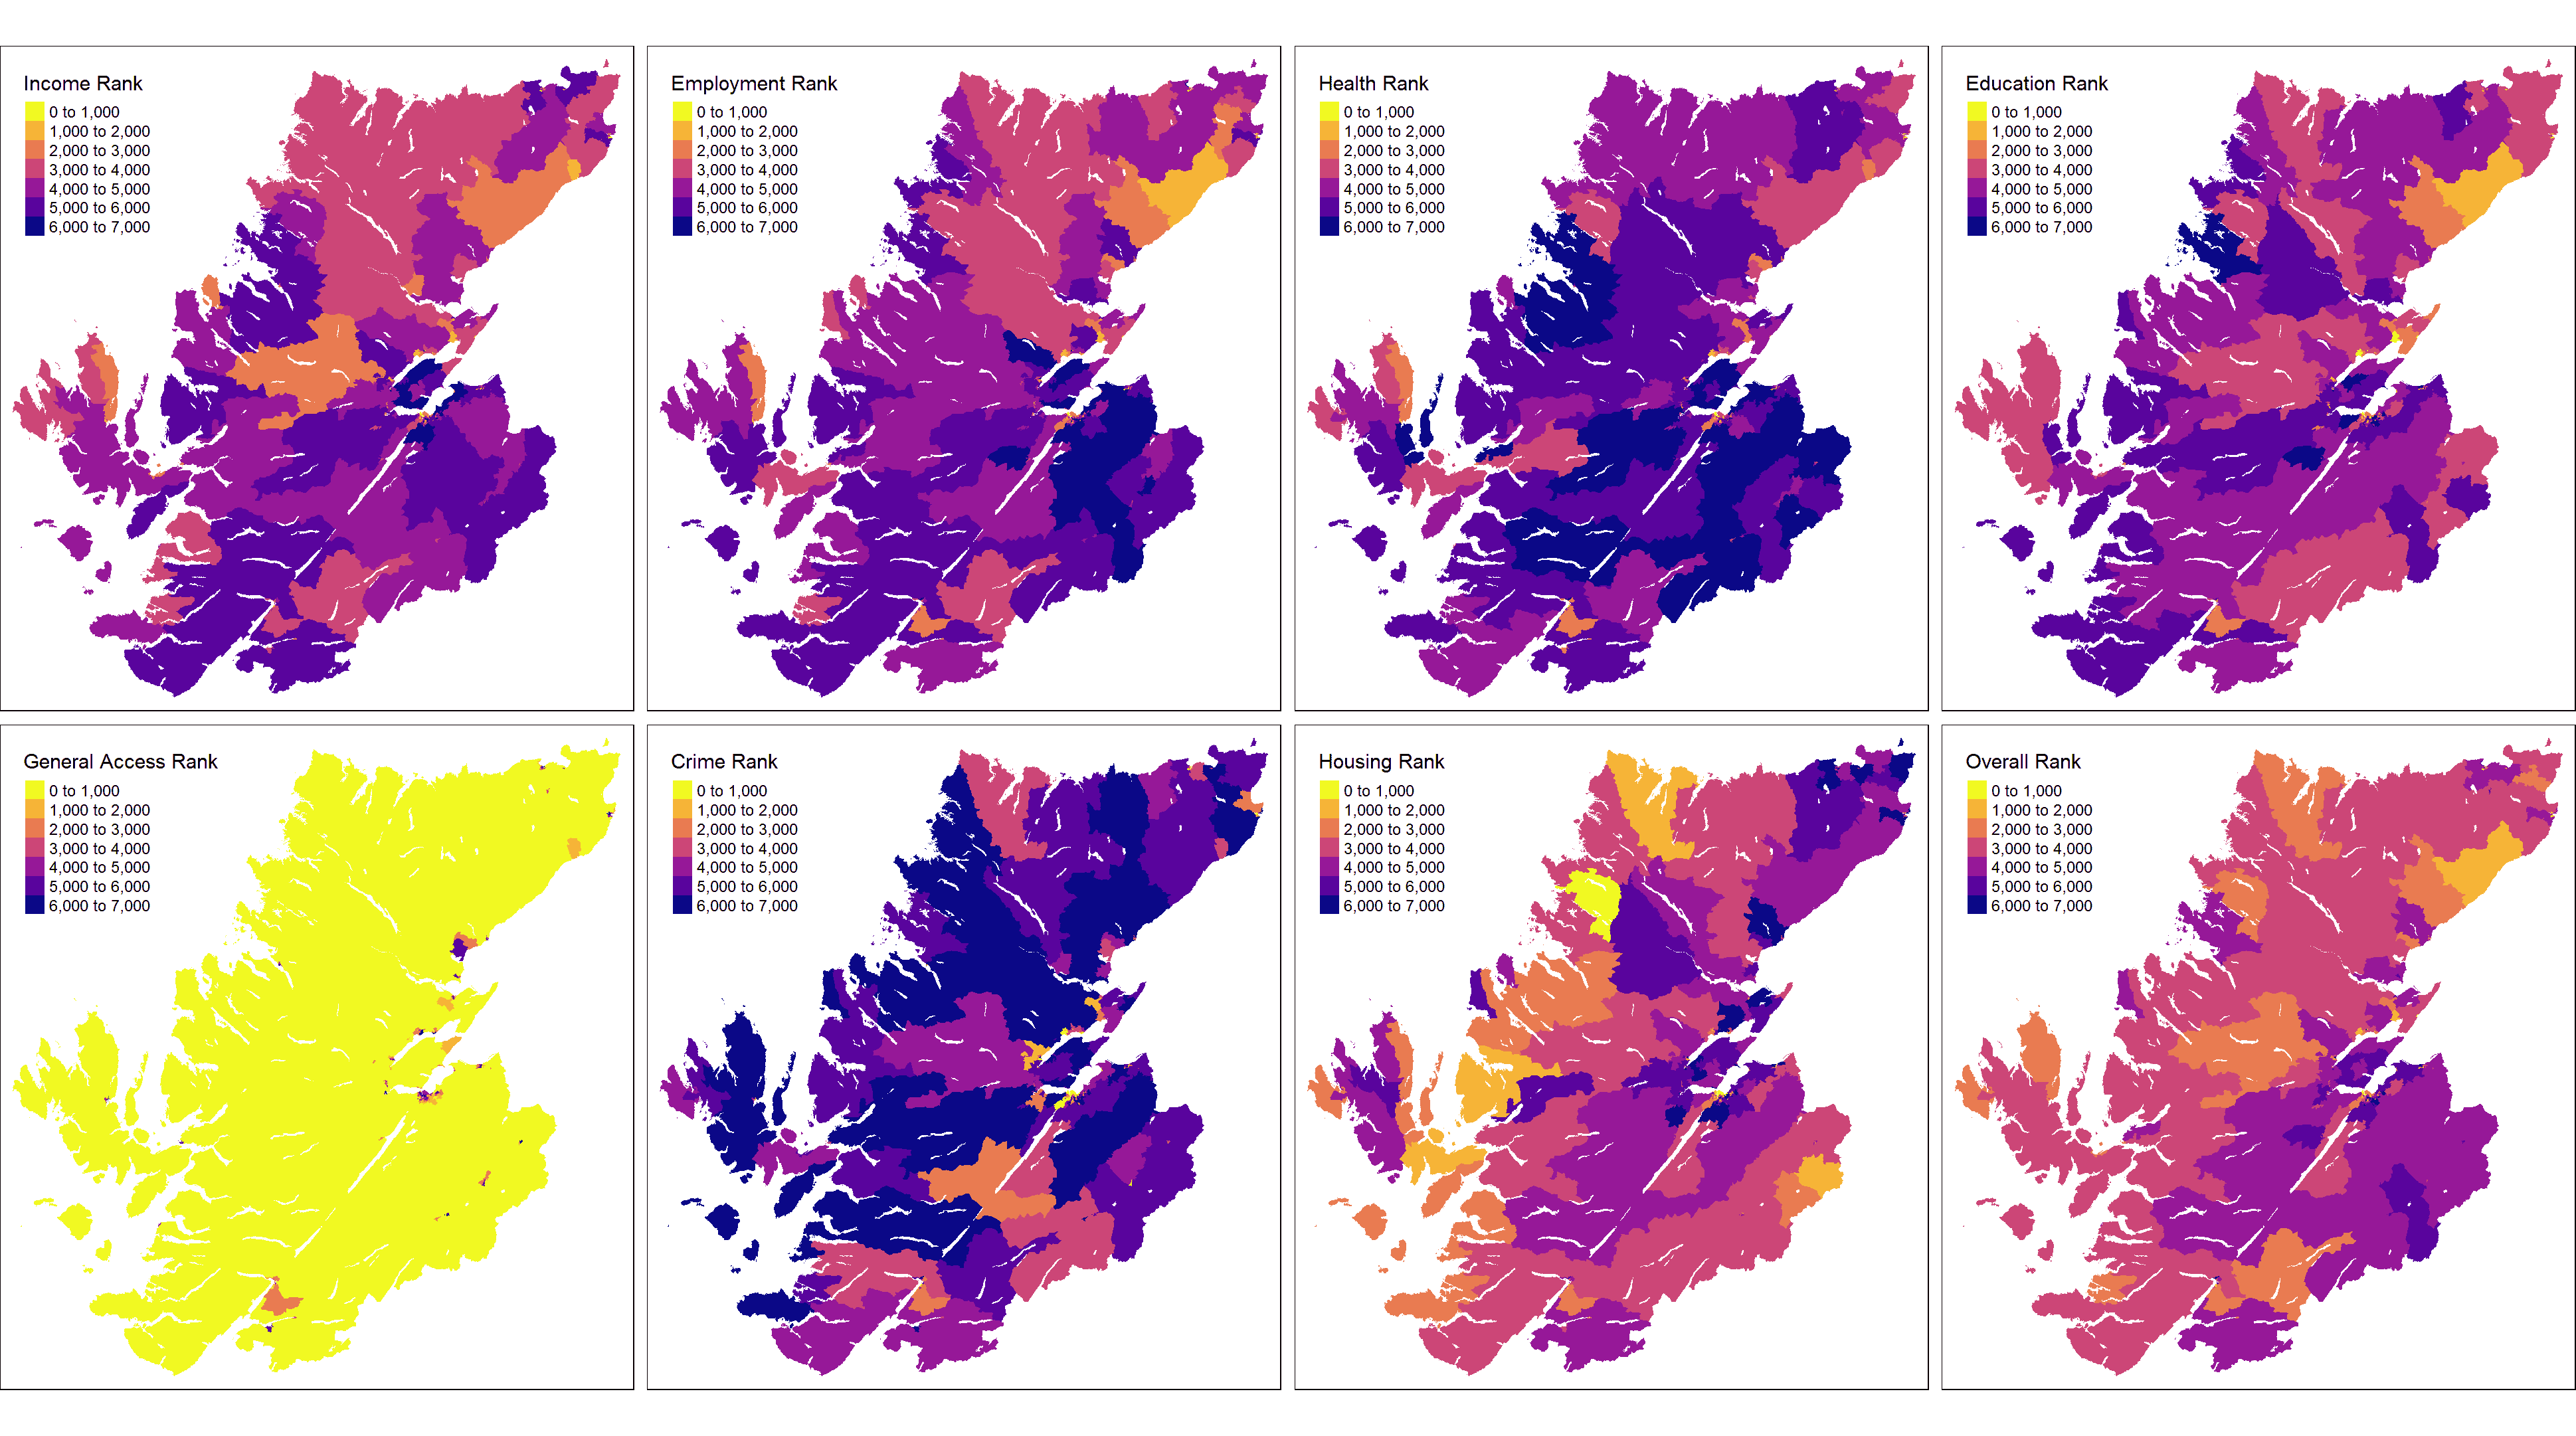
Mapping to a 't'(map)
the tmap package for beautiful static and interactive maps with R Continue reading Mapping to a 't'(map)
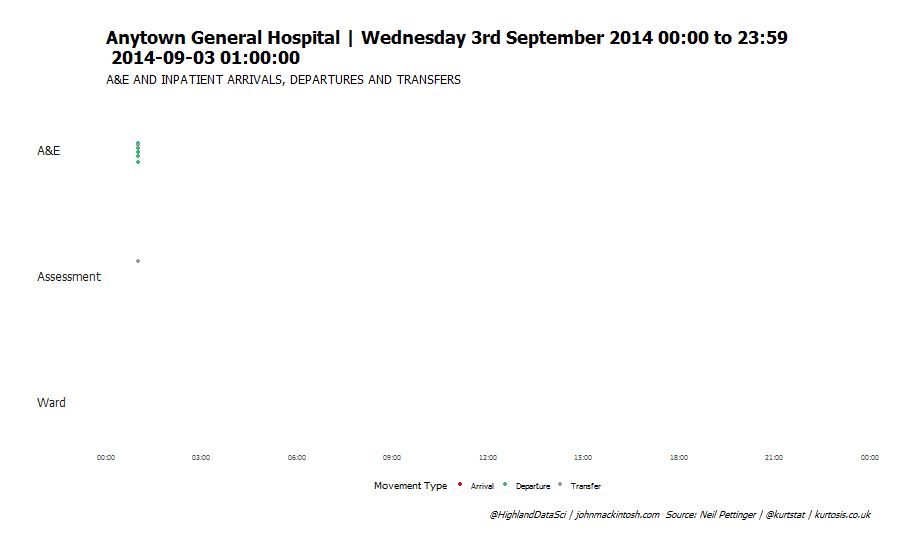
Let it flow, let it flow, let it flow......
Visualising patient flow with animated dotplots Continue reading Let it flow, let it flow, let it flow......

It's a dirty job, but someone's got to do it..
A tidytext analysis of Faith No More lyrics Continue reading It's a dirty job, but someone's got to do it..
See Data by John for more
Most of the posts here are inspired by challenges I’ve overcome at work.
Or, they act as preparation / learning for new tasks I want to complete at work.
Hence, my new tag line “data science that works” - because this is exactly the same approach that I’ve used in my role.
Topics covered in this blog
- R programming
- SQL
- data visualisation
- data.table
- Excel and PowerBI
- tidyverse
- automating workflows
- parameterised SQL
- data visualisation
- text mining and sentiment analysis
- package development
- spatial data analysis (mapping)
- how to use {targets}
cusumcharter
An R package for CUSUM control charts, now available on CRAN. Continue reading cusumcharter
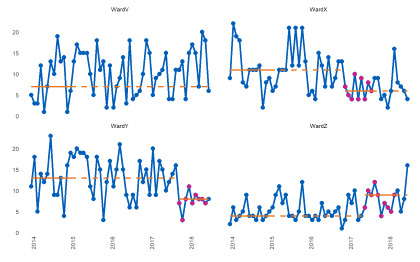
runcharter
An R package for quality improvement analysis, now available on CRAN. Continue reading runcharter
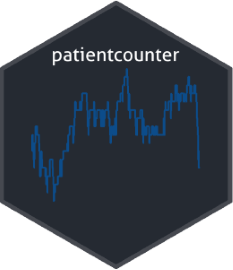
patientcounter
Track patient movements with ease. Continue reading patientcounter
See Projects for more