More tidy evaluation with ggplot2 (Last updated: 2025-05-02)
Another look at tidy evaluation with a slight twist on the previous post
After my previous post, my good friend David Henderson asked a good question on Twitter ( it happens :))
To be honest, I hadn’t even noticed there was no tilde (the ‘~’ ) in my call to facet_wrap.
So I did a little experiment :
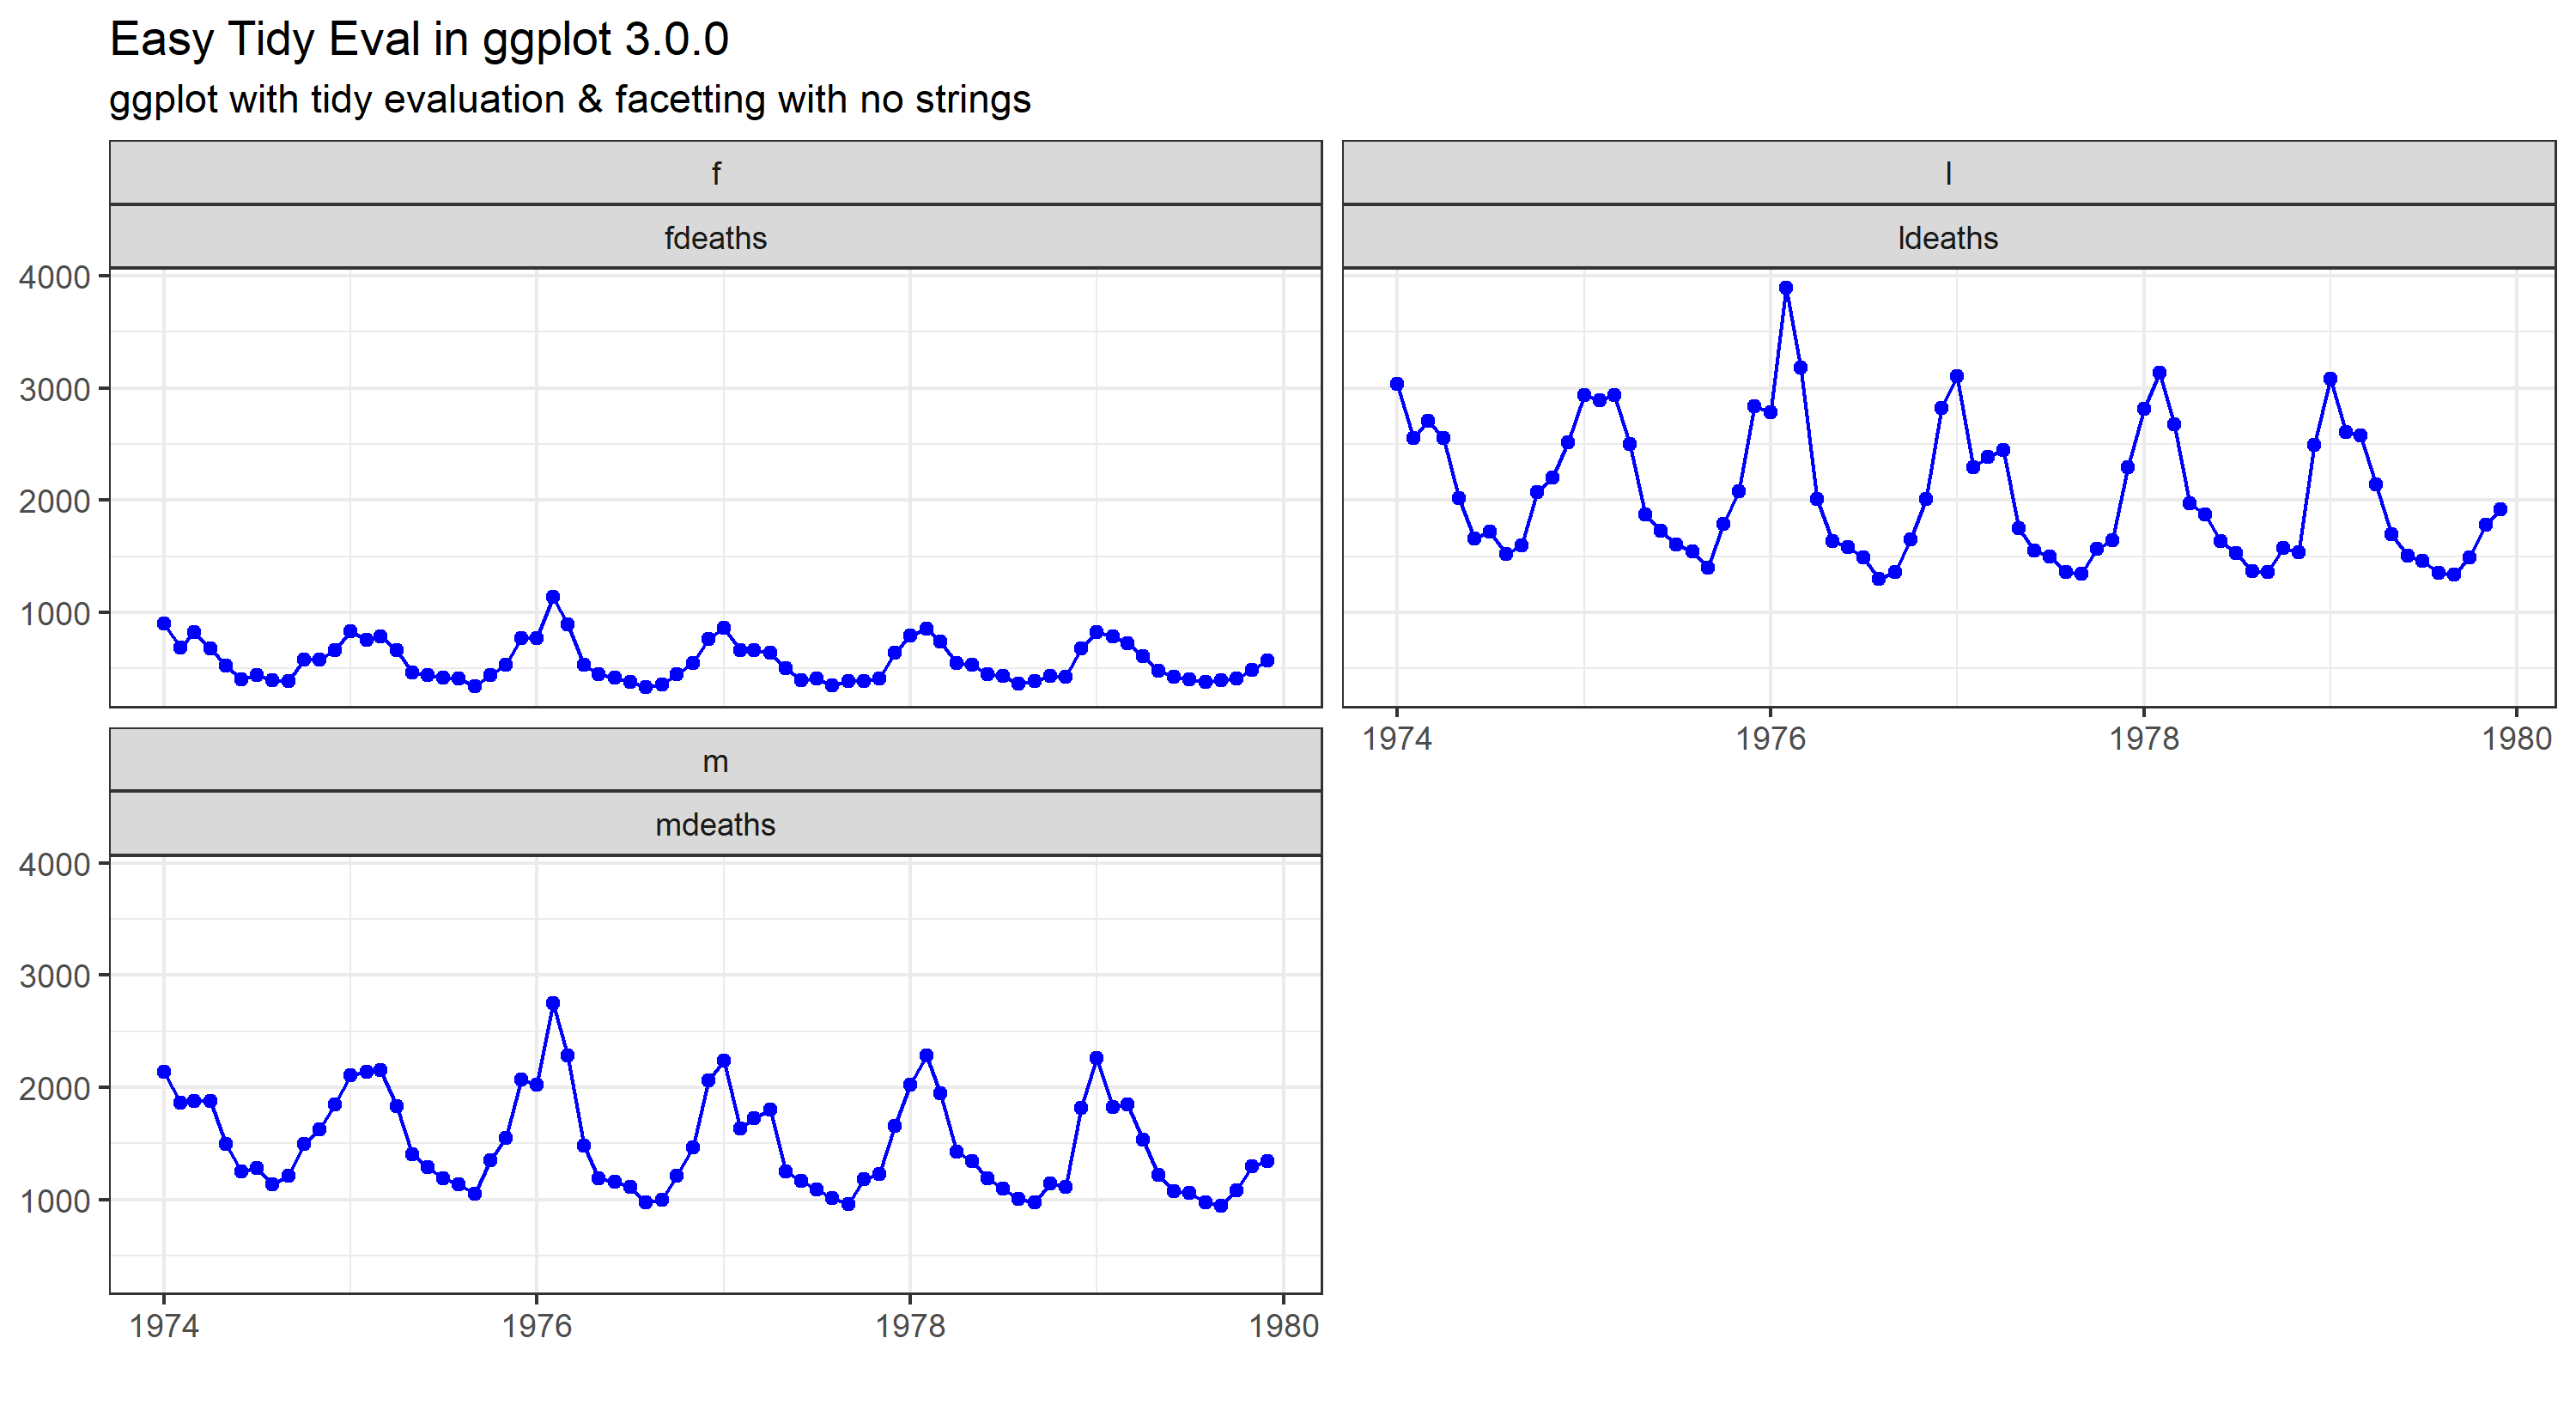
library(dplyr) library(ggplot2) library(tidyr) library(tibble) data <- list(fdeaths, mdeaths, ldeaths) #time series data - needs prep names(data)[1:3] <- c("fdeaths", "mdeaths", "ldeaths") data <- as_tibble(data) startdate <- as.Date('1974-1-1') data$date <- seq.Date(startdate,by = 'month',length.out = 72) newdata <- tidyr::gather(data, key = key, value = value,-date) newdata$value <- as.numeric(newdata$value) # adding in an additional colum to facet by newdata$random <- stringr::str_sub(newdata$key,1,1) gtest <- function(df,x,y,...) { # check out the ... in the function parameters x_quo <- enquo(x) y_quo <- enquo(y) groupvars <- quos(...) ## this is a new bit too p <- ggplot(df,aes(x = !!x_quo, y = !!y_quo)) + #bangin' geom_line(colour = "blue", group = 1) + geom_point(colour = "blue") + facet_wrap(groupvars, ncol = 2) #look Ma, no tilde. Also, 2 cols, not 3 p <- p + ggtitle(label = "Easy Tidy Eval in ggplot 3.0.0", subtitle = "ggplot with tidy evaluation & facetting with no strings") p <- p + labs(x = NULL, y = NULL, caption = "") + theme_bw() print(p) } gtest(newdata, date, value, random, key)
Pretty cool huh?
What’s different here?
Well, I added in ‘…’ to the definition, and assigned groupvars using quos(…) Prior to that I’d taken the first letter of the key column as a new additional grouping column. So now we have 2 columns to facet_wrap.
Normally we’d use
facet_wrap(random ~ key) Or vice versa. But, I didn’t need to do that, I just specified ‘groupvars’ as the faceting variable, and changed the number of columns to prove it actually does what I want.
facet_wrap(groupvars, ncol = 2) Cleverer people than me will be able to explain this magic, but in the meantime, if you need to create a faceted ggplot2 function, I hope this post and the previous one help you get off the ground.
If you like this, please consider liking it (wherever is appropriate) and / or sharing it. Tag me on Twitter if you do ! @_johnmackintosh
Also clever peeps are welcome to explain the magic in the comments down below.
Cheers :)